NVDA · NASDAQ · US SEMICONDUCTORS

NVIDIA Corporation

AI infrastructure leader with exceptional Data Center momentum. This research case asks whether the quality of the business can continue to exceed already high market expectations.

$96.2bnQ2 FY27 revenue
$89.0bnQ2 FY27 Data Center revenue
75.0%Q2 FY27 gross margin
$108.0bnQ3 FY27 revenue outlook
Investment view

Exceptional execution, limited valuation cushion.

NVIDIA is capturing a large share of a rapidly expanding AI-infrastructure market, supported by its compute, networking, systems and CUDA software ecosystem. The fundamental question is not whether recent performance is strong; it is whether revenue growth, margin durability and cash conversion can stay ahead of demanding expectations.

What supports the case

  • Data Center growth remains the central driver, supported by hyperscale, AI-cloud, industrial and enterprise demand.
  • Blackwell Ultra drove the latest quarter, while Vera Rubin is the next architecture ramp to monitor.
  • Full-platform integration can make customer switching a system-level decision, rather than a single-chip comparison.

What the model must prove

  • Demand conversion remains durable as data-centre buildouts face power, land and financing constraints.
  • High gross margins can normalise gradually rather than fall sharply as mix and competition evolve.
  • Cash collection keeps pace with revenue as receivables and inventory increase.
Valuation

Base-case DCF

$169.16

Base-case implied value per share from the supporting model, compared with a $168.89 market reference captured on 11 November 2026. This is a sensitivity-based estimate, not a price target.

Python analysis

Reproducible checks behind the research.

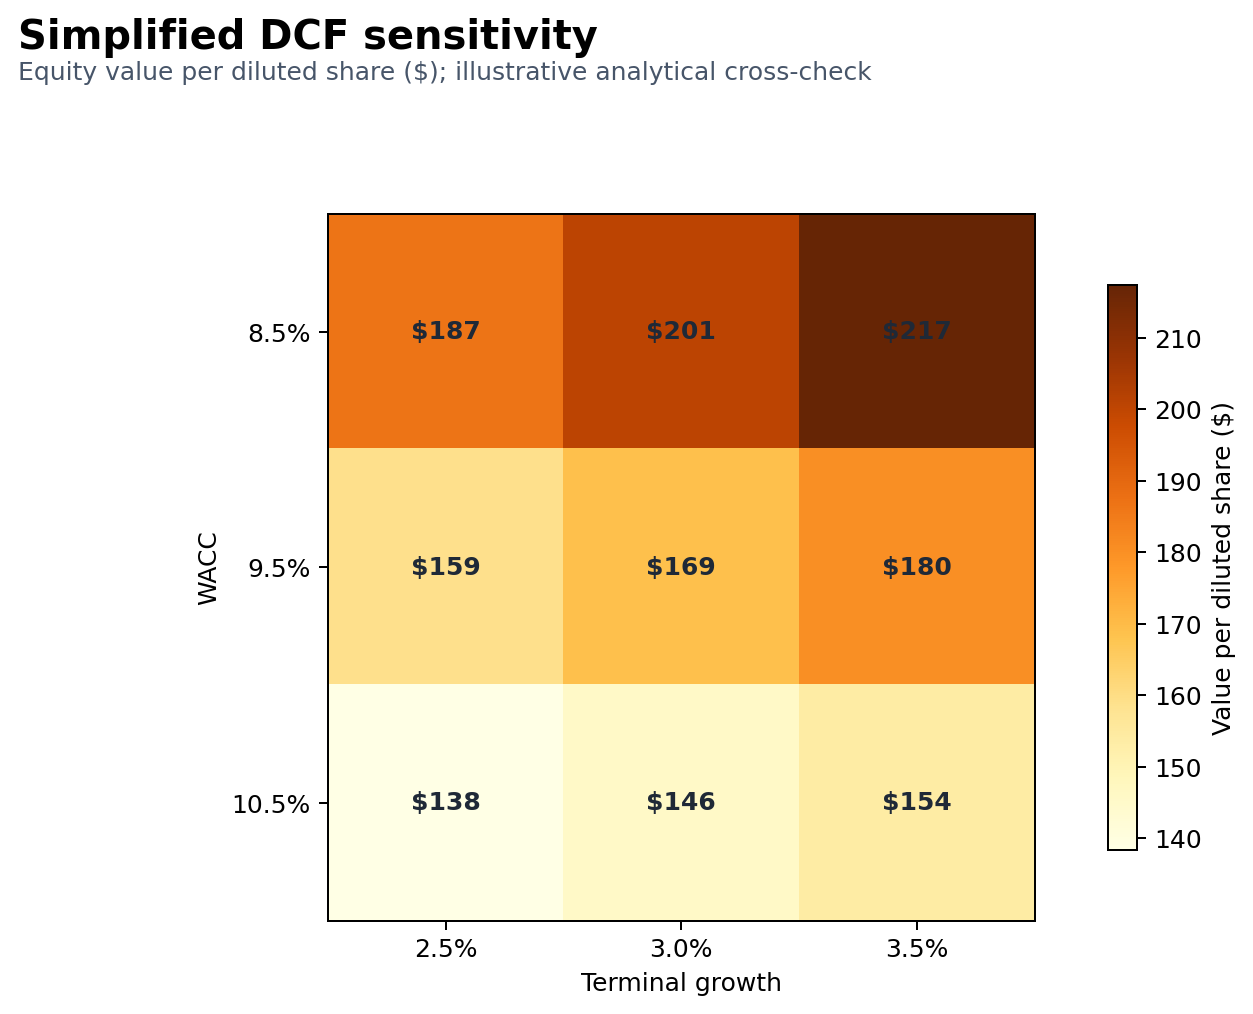
Python is used to validate source-controlled inputs, calculate operating metrics and generate report-ready charts. The DCF matrix is a simplified code-based cross-check; the detailed Excel model remains the primary valuation workbook.

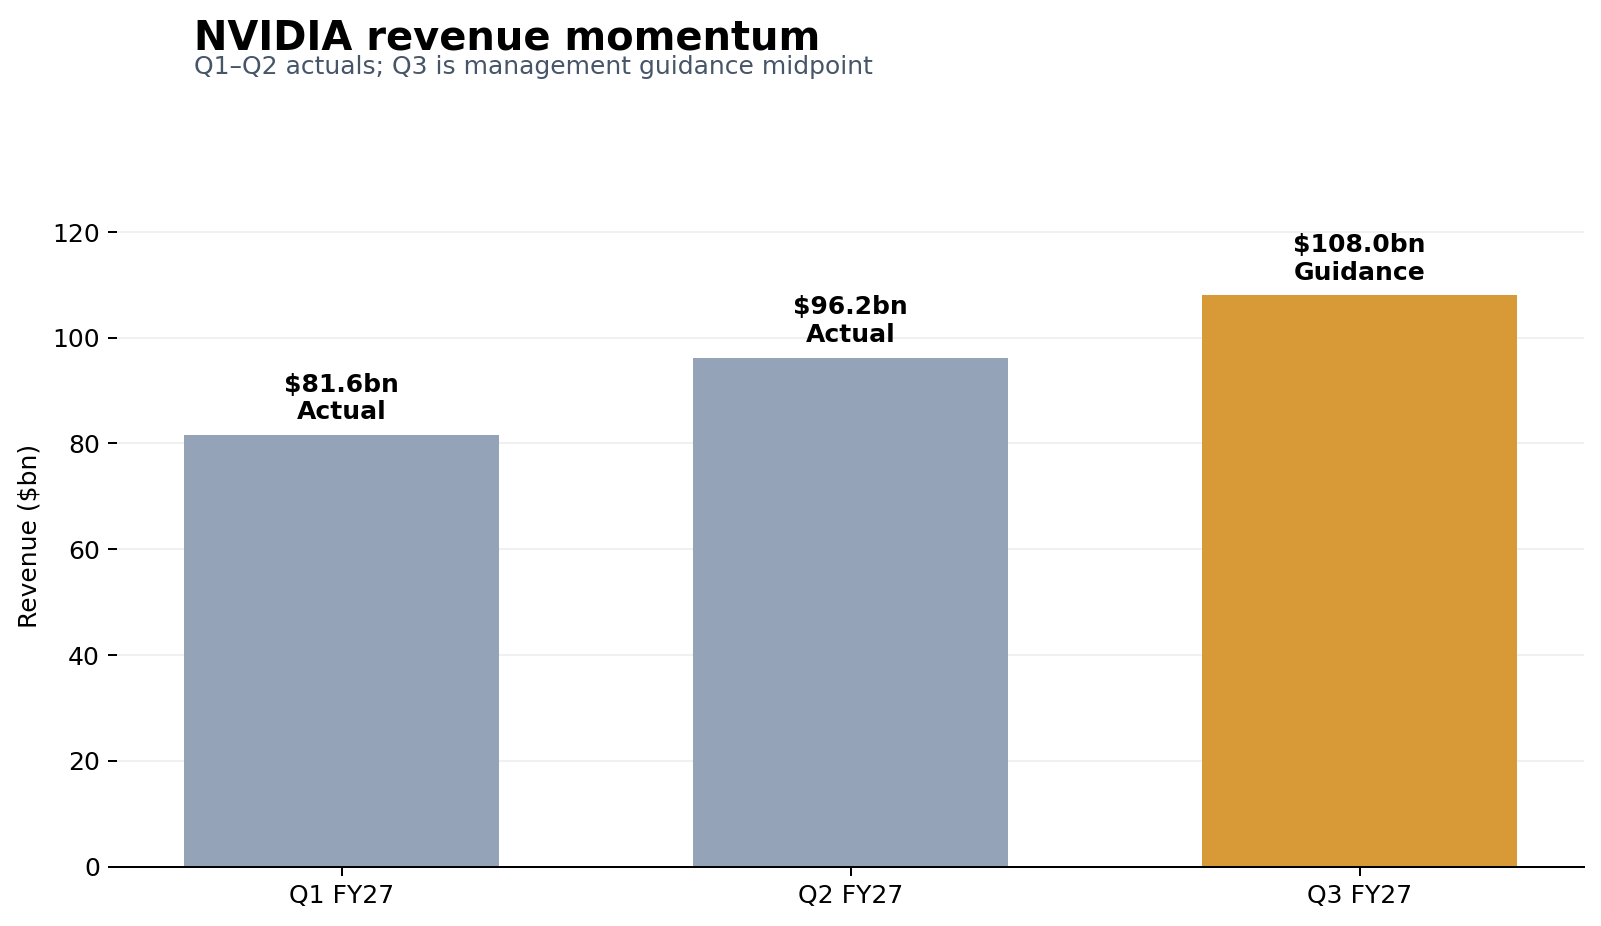
NVIDIA revenue grew from $81.6bn in Q1 FY27 to $96.2bn in Q2 FY27, with Q3 guidance of $108.0bn.

Revenue momentum: Q1–Q2 actuals and Q3 FY27 management guidance midpoint.

Simplified NVIDIA DCF sensitivity across WACC and terminal-growth assumptions.

DCF sensitivity: a $169 base-case cross-check at 9.5% WACC and 3.0% terminal growth.

Financial review

What the latest filing says

MetricReported evidenceResearch read-through
Six-month revenue$177.8bn, up 96% year on yearConfirms unusually strong AI infrastructure demand.
Operating margin66.0% in the first half of FY27Operating leverage is exceptional, but high margins need to be stress-tested.
Operating cash flow$74.4bn in the first half of FY27Strong conversion, partly offset by working-capital absorption.
Accounts receivable$63.1bn, versus $38.5bn at FY26 year endExtended payment terms make collections an important monitoring item.
Inventories$31.6bn, versus $21.4bn at FY26 year endSupports supply availability but increases fast-cycle inventory risk.

Catalysts

  • Successful Vera Rubin product ramp and sustained system demand.
  • Broader adoption from enterprise, sovereign and inference workloads.
  • Improving cash conversion and evidence that customer demand is diversifying.
  • Capital returns supported by strong cash generation.

Bear case and risks

  • Customer concentration and a slowdown in AI infrastructure budgets.
  • Export-control restrictions and reduced China Data Center opportunity.
  • Gross-margin pressure from product mix, supply or competition.
  • Large supply, cloud and infrastructure commitments if demand does not convert as expected.
Monitoring framework

What would change the view

A more constructive view would require evidence that demand breadth, platform durability and cash conversion can sustain growth beyond the modelled taper. A more cautious view would follow from slowing Data Center orders, persistent receivables expansion, margin pressure or weaker customer AI infrastructure budgets. The next formal refresh is after Q3 FY27 results, scheduled for 17 November 2026.

Supporting work

Inspect the research behind the conclusion.

These files show the full research note and the driver-led financial model used to develop the valuation and sensitivity analysis.

Educational portfolio content only. Figures and conclusions are current only as of 11 November 2026 and are not investment advice.